Logs with Loki
Assignment
"On Saturday three customers got an error message at checkout," Veloatelier Matte writes. "Can you find out what happened?"
Learning goals
After this chapter you can:
- Explain what logs show that metrics do not
- Describe how Loki and Alloy are set up in the cluster
- Filter and count logs by namespace, pod and text with LogQL
- Find the error of a deployment in the logs
Logs and metrics
Section titled “Logs and metrics”Metrics are numbers at fixed intervals. They show that 5% of the requests fail, but not which ones and with what message. Logs are lines of text a program writes when something happens. They hold the details but take more storage. In Kubernetes, every container writes its logs to standard output and standard error, and the node stores them as files. kubectl logs reads these files, but only as long as the pod exists. Once it is replaced, its logs are gone.
Loki and Alloy
Section titled “Loki and Alloy”Loki collects logs centrally and keeps them beyond the end of a pod. A full-text search engine indexes all of the text. Loki only indexes a few labels such as namespace and pod and searches the text when you run a query. This keeps Loki small, but every search has to start by narrowing down with labels.
Alloy from Grafana runs as a DaemonSet, with one pod per node. Each of them reads the logs of the pods on its node, adds labels and sends them to Loki. Both came into your repo with the copy in chapter 5.1, as two applications in apps/loki.yaml. The Alloy 1.21 guide for Kubernetes installs the same chart with Helm.
# Values of the chart loki for the lab, chapter 5.2. One process with its data on the disk of a nodedeploymentMode: SingleBinary
loki:  auth_enabled: false  commonConfig:    replication_factor: 1  storage:    type: filesystem  schemaConfig:    configs:      - from: "2026-01-01"        store: tsdb        object_store: filesystem        schema: v13        index:          prefix: index_          period: 24h  # Logs older than three days are deleted  limits_config:    retention_period: 72h  compactor:    retention_enabled: true    delete_request_store: filesystem
singleBinary:  replicas: 1  persistence:    size: 5Gi  resources:    requests:      cpu: 100m      memory: 256Mi
# The parts of a scalable installation stay offread:  replicas: 0write:  replicas: 0backend:  replicas: 0chunksCache:  enabled: falseresultsCache:  enabled: falsegateway:  enabled: falselokiCanary:  enabled: falsetest:  enabled: false
Here Loki runs as a single process and stores its data on the disk of a node. That is enough for a lab. In production you would spread Loki over several processes and keep the data in object storage. Loki deletes logs older than three days. The mode SingleBinary also appears in the Loki 3.6 guide to the monolithic chart, there with object storage.
# Values of the chart alloy for the lab, chapter 5.2. One Alloy per node reads the logs of its podsalloy:  configMap:    # Alloy expects one attribute per line, a block written on one line fails with "expected TERMINATOR"    content: |      discovery.kubernetes "pods" {        role = "pod"        selectors {          role  = "pod"          field = "spec.nodeName=" + sys.env("NODE_NAME")        }      }
      discovery.relabel "pods" {        targets = discovery.kubernetes.pods.targets        rule {          source_labels = ["__meta_kubernetes_namespace"]          target_label  = "namespace"        }        rule {          source_labels = ["__meta_kubernetes_pod_name"]          target_label  = "pod"        }        rule {          source_labels = ["__meta_kubernetes_pod_container_name"]          target_label  = "container"        }        rule {          source_labels = ["__meta_kubernetes_pod_label_app"]          target_label  = "app"        }      }
      loki.source.kubernetes "pods" {        targets    = discovery.relabel.pods.output        forward_to = [loki.write.default.receiver]      }
      loki.write "default" {        endpoint {          url = "http://loki.monitoring.svc:3100/loki/api/v1/push"        }      }  # Every Alloy only reads the pods of its own node  extraEnv:    - name: NODE_NAME      valueFrom:        fieldRef:          fieldPath: spec.nodeName  resources:    requests:      cpu: 20m      memory: 64Micontroller:  type: daemonset
The Alloy configuration is a chain of four components. discovery.kubernetes finds the pods of its own node. discovery.relabel turns Kubernetes details into the labels namespace, pod, container and app. loki.source.kubernetes reads the logs, and loki.write sends them to Loki. More examples with these components are in the Alloy 1.21 guide to Kubernetes logs. In the test setup, a configuration with a block written on one line failed with "expected TERMINATOR". Alloy wants every attribute on a line of its own.
In the lab, Loki and Alloy were ready a little over two minutes after the push. Argo CD had created their applications about 40 seconds earlier.
kubectl -n monitoring get pods -o wide | grep -E 'loki|alloy'You write queries in Grafana under "Explore" with the data source Loki. A query always starts with a selection of streams in curly braces.
| Query | Result |
|---|---|
{namespace="velo"} | all logs of the bike shop |
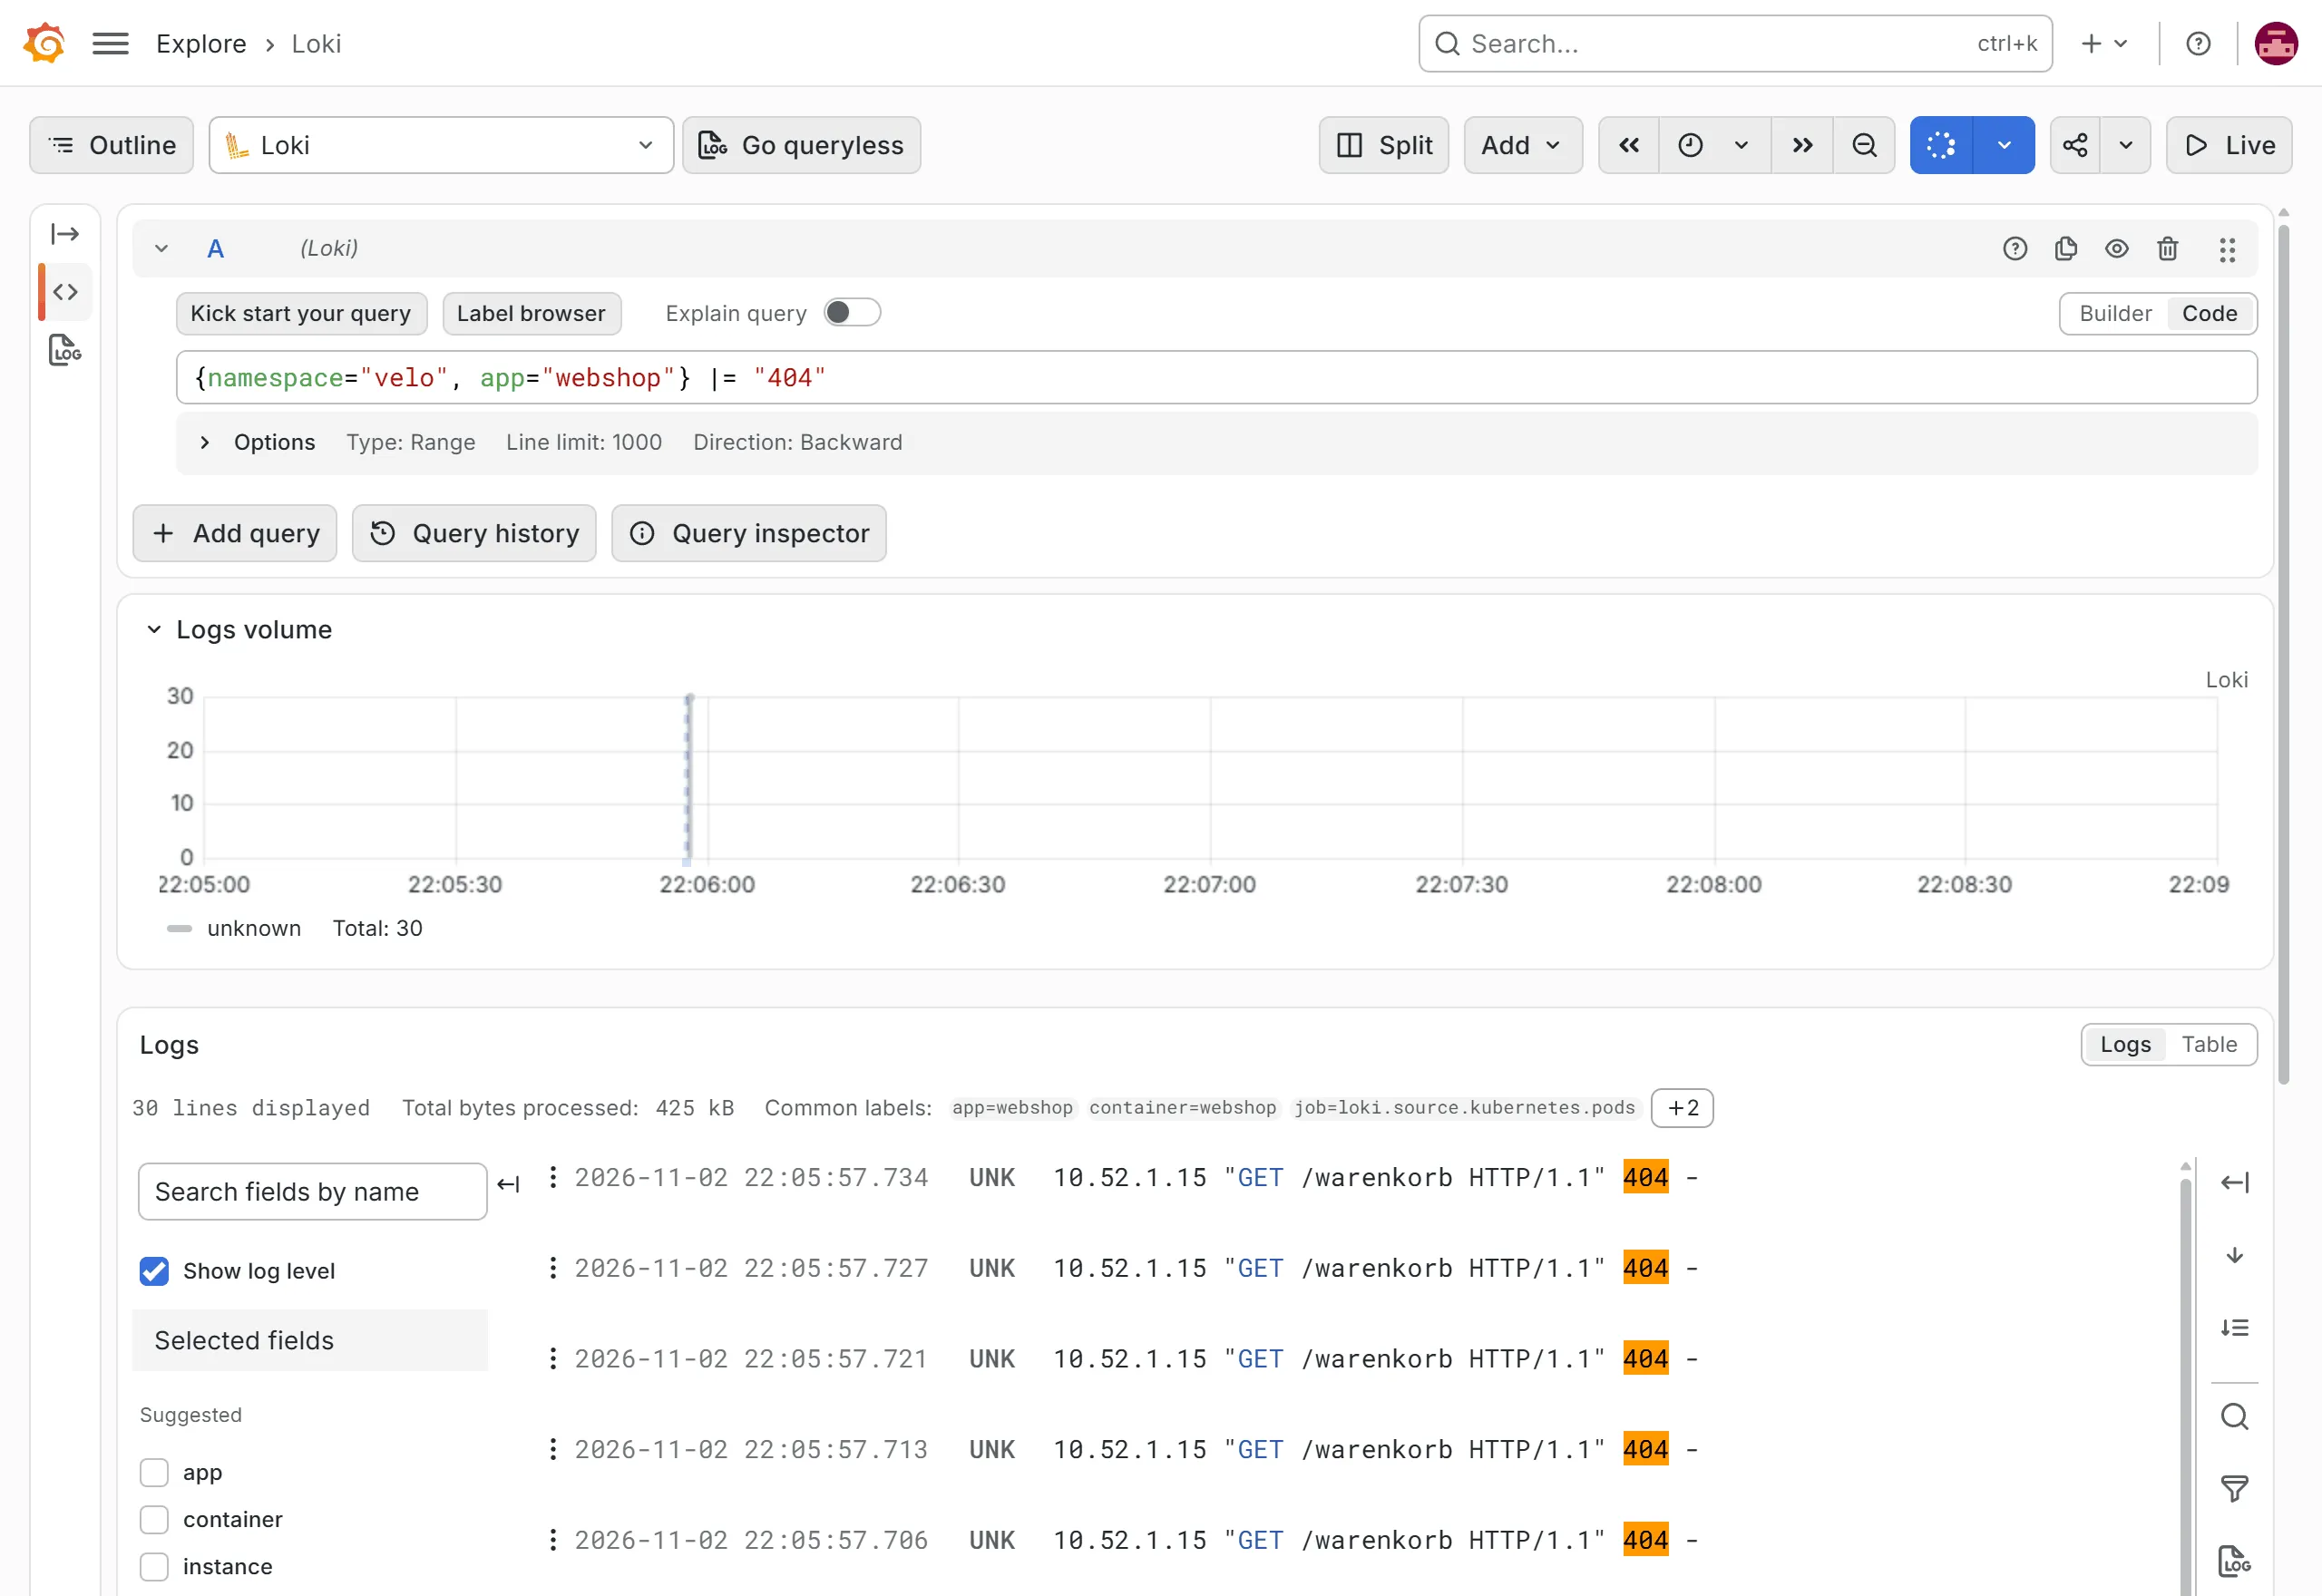
{namespace="velo", app="webshop"} |= "404" | lines of the web shop containing 404 |
{namespace="velo"} |~ "(?i)error|exception" | lines matching the regular expression |
{namespace="velo"} != "/healthz" | everything except the Kubernetes probes |
sum by (pod) (count_over_time({namespace="velo"} |= " 404 " [5m])) | number of lines with 404 per pod in five minutes |
|= filters by text, |~ by a regular expression, and != excludes lines with the text. count_over_time counts the lines in a time window and turns logs into a metric you can use in dashboards and alerts.
In the lab, 20 requests for a page that does not exist produced lines with 404.
for i in $(seq 20); do curl -s -o /dev/null http://<server-address>/warenkorb; done10.52.1.10 "GET /warenkorb HTTP/1.1" 404 -Traefik spreads the requests across the pods. The query with count_over_time then showed how many of these requests each pod had answered.
In Grafana you run the query under "Explore" with the data source Loki.
Labels in moderation
Section titled “Labels in moderation”In Loki, every combination of labels is a stream of its own. Labels such as namespace, pod or app have few values and work well. An IP address, an order number or a path as a label would create thousands of streams and slow Loki down. Whatever changes often stays in the text and is found with |=.
Exercise Lab
Roll out Loki and Alloy, create requests with 404 and find them in Grafana. Count them per pod.
Solution
{namespace="velo", app="webshop"} |= "404" shows the lines with /warenkorb, and the label pod tells you which pod answered. sum by (pod) (count_over_time({namespace="velo"} |= " 404 " [5m])) shows one number per pod, about 20 together.
Exercise Finding the error
First stage the fault as if you were someone else on the team. The command sets the variable FAIL_PERCENT in the web shop deployment to 30, so the shop answers three out of ten requests with an error.
cd ~/platformsed -i '/FAIL_PERCENT/{n;s/value: "0"/value: "30"/}' webshop/deployment.yamlgit commit -am "Tune the web shop"git pushOnce Argo CD has picked up the change, call the shop a few times. Use the logs to find out what customers experience and the Git history to find out who did it. Then restore the old state.
Solution
{namespace="velo", app="webshop"} |= "error" shows lines like error: simulated failure on /, next to lines with status 500. git log -p webshop/deployment.yaml shows the commit with its author and the change, and its time matches the first error line. git revert followed by git push restores the old state, and Argo CD rolls it out.
Exercise One label too many
A colleague suggests setting the customer's IP address as a label in Alloy, so that you can search for a customer faster. What do you answer?
Solution
Every address would be a stream of its own, thousands with many customers. Loki would get slower and need more storage. Values that change often belong in the text and are searched with |=. In the lab, though, the text only holds the address of Traefik, such as 10.52.1.10. The web shop sees the connection from Traefik, not the one from the customer. Data protection matters too. An IP address is personal data, and storing it needs a purpose and a retention period.
Text and figures are licensed under CC BY-SA 4.0 and the code under the MIT License. The sources are on GitHub.