Metrics with Prometheus
Assignment
"It's spring, and the bike shop's web shop gets slower every Saturday," Simone Wyss writes. "Praxis Rosenweg wants to know whether the platform is up before patients call. And I want to see whether our nodes still have room."
Learning goals
After this chapter you can:
- Name the four golden signals and explain what monitoring is for
- Explain the Prometheus model with time series, labels, exporters and pulling
- Roll out the monitoring stack through Argo CD from your platform repo
- Add OpenNebula and the web shop as targets
- Write simple PromQL queries and show them in Grafana
The purpose of monitoring
Section titled “The purpose of monitoring”Monitoring should show what is broken and why. Customers often notice that something is wrong, for example when the shop is slow. The reason only shows up inside the system, such as full disks or a node without free memory. Google's book "Site Reliability Engineering" names four golden signals worth measuring for every service.
| Signal | Question | For the web shop |
|---|---|---|
| Latency | How long does an answer take? | response time of / |
| Traffic | How much is asked for? | requests per second |
| Errors | How much goes wrong? | share of 5xx answers |
| Saturation | How full is the system? | CPU of the pods, memory of the nodes |
Prometheus
Section titled “Prometheus”Prometheus stores time series. A time series is a name with labels and a sequence of timestamped values.
webshop_requests_total{code="200", path="/", pod="webshop-599c7b4f94-4htg9"} 1532Prometheus pulls the values itself, usually every 15 to 30 seconds. Every target offers a text page at /metrics. Programs that cannot do that get an exporter, a small program that collects values and prints them in the Prometheus format. The web shop of chapter 4.4 already has /metrics built in.
| Type | Meaning | Example |
|---|---|---|
| Counter | only counts up, until a restart | webshop_requests_total |
| Gauge | can go up and down | opennebula_host_mem_usage_bytes |
| Histogram | counts values in buckets, for percentiles | webshop_request_duration_seconds_bucket |
The stack
Section titled “The stack”kube-prometheus-stack is a Helm chart of the Prometheus community. It contains Prometheus, Alertmanager, Grafana, the Prometheus Operator, kube-state-metrics for the state of the cluster objects and node-exporter for the nodes. The operator adds resource types of its own. A ServiceMonitor tells Prometheus which services to scrape, a ScrapeConfig names targets outside the cluster, and a PrometheusRule holds rules.
Like the web shop, the stack comes from Git. The additions for part 5 are in the course repo under platform/observability/repo. You copy them over your platform repo and replace the placeholders with your addresses.
source /etc/cc-lab.envcd ~/platformcp -r ~/cc/platform/observability/repo/. .sed -i "s#http://FRONTEND:3000#http://$CC_FE_IP:3000#" apps/*.yamlsed -i "s/FRONTEND_IP/$CC_FE_IP/; s/NODE1_IP/$CC_NODE1_IP/; s/NODE2_IP/$CC_NODE2_IP/" monitoring/config/opennebula.yamlgit statusgit status shows new applications in apps, the folder monitoring and changed files in webshop and templates/member. Before you push, you store the Grafana password as a secret so that it stays out of Git.
#!/bin/bash# Creates the secrets of the monitoring stack that do not belong in Git, chapter 5.1.##   ~/cc/platform/observability/make-secrets.sh## The Grafana password is stored in ~/cc-lab/grafana.pass.set -euo pipefail
pass_file=~/cc-lab/grafana.passif [ ! -f "$pass_file" ]; then install -m 0600 /dev/null "$pass_file" openssl rand -hex 12 > "$pass_file"fikubectl create namespace monitoring --dry-run=client -o yaml | kubectl apply -f -kubectl -n monitoring create secret generic grafana-admin \ --from-literal=admin-user=admin \ --from-literal=admin-password="$(tr -d '\n' < "$pass_file")" \ --dry-run=client -o yaml | kubectl apply -f -echo "Grafana user admin, password in $pass_file"~/cc/platform/observability/make-secrets.shThe application monitoring takes the chart from the community repo and the values from your Gitea. Argo CD can combine several sources in one application for that.
# Prometheus, Alertmanager and Grafana from the chart kube-prometheus-stack, the values come from this repoapiVersion: argoproj.io/v1alpha1kind: Applicationmetadata: name: monitoring namespace: argocdspec: project: default sources: - repoURL: https://prometheus-community.github.io/helm-charts chart: kube-prometheus-stack targetRevision: 92.17.0 helm: releaseName: monitoring valueFiles: - $values/monitoring/kube-prometheus-stack.yaml - repoURL: http://FRONTEND:3000/wolkenwerk/platform.git targetRevision: main ref: values destination: server: https://kubernetes.default.svc namespace: monitoring syncPolicy: automated: prune: true selfHeal: true syncOptions: - CreateNamespace=true # The definitions of the operator are too large for the annotation of a client-side apply - ServerSideApply=true# Values of kube-prometheus-stack for the lab, chapter 5.1
# k3s runs etcd, scheduler, controller manager and proxy inside one process, their own monitors find nothingkubeEtcd: enabled: falsekubeControllerManager: enabled: falsekubeScheduler: enabled: falsekubeProxy: enabled: false
prometheus: service: type: NodePort nodePort: 30090 prometheusSpec: retention: 3d resources: requests: cpu: 100m memory: 512Mi # Read monitors, rules and scrape configs of every namespace, not only those of this chart serviceMonitorSelectorNilUsesHelmValues: false podMonitorSelectorNilUsesHelmValues: false ruleSelectorNilUsesHelmValues: false scrapeConfigSelectorNilUsesHelmValues: false storageSpec: volumeClaimTemplate: spec: accessModes: [ReadWriteOnce] resources: requests: storage: 5Gi
alertmanager: # Every alert goes to the receiver null, the advanced tasks add a receiver of their own config: route: receiver: "null" group_by: [alertname, namespace] group_wait: 30s group_interval: 5m repeat_interval: 4h receivers: - name: "null" service: type: NodePort nodePort: 30093 alertmanagerSpec: resources: requests: cpu: 10m memory: 64Mi
grafana: service: type: NodePort nodePort: 30300 # The password lives in a secret that make-secrets.sh creates, not in Git, part 6 replaces it with a SealedSecret admin: existingSecret: grafana-admin userKey: admin-user passwordKey: admin-password additionalDataSources: - name: Loki type: loki uid: loki url: http://loki.monitoring.svc:3100 # Dashboards from config maps with the label grafana_dashboard in any namespace sidecar: dashboards: enabled: true searchNamespace: ALLk3s runs scheduler, controller manager and proxy in a single process. The monitors the chart ships for them would find nothing and stay red, so they are switched off. The chart's README for version 92.17.0 covers the installation, the values and, for Argo CD, the option ServerSideApply.
OpenNebula as a target
Section titled “OpenNebula as a target”For the IaaS layer, OpenNebula ships exporters of its own in the package opennebula-prometheus-kvm. The OpenNebula exporter runs on the front-end and reports hosts, VMs and datastores on port 9925 as OpenNebula sees them. On the front-end and on both nodes, node_exporter on port 9100 reports the values of the operating system. The nodes also run the libvirt exporter on port 9926, which shows the VMs as KVM sees them. Do not install the package opennebula-prometheus. It would bring a second Prometheus. For the exporters, the script below follows the OpenNebula 7.4 guide, which installs that package as well.
#!/bin/bash# Installs the Prometheus exporters of OpenNebula, the step of chapter 5.1. Run it on the front-end.##   ~/cc/platform/observability/install-exporters.sh## Front-end: the OpenNebula exporter (port 9925) and node_exporter (9100).# Nodes: node_exporter (9100) and the libvirt exporter (9926).# The package opennebula-prometheus would bring a Prometheus of its own, the cluster already has one.set -euo pipefail
# shellcheck source=/dev/nullsource /etc/cc-lab.env
sudo apt-get install -y opennebula-prometheus-kvmsudo systemctl enable --now opennebula-exporter opennebula-node-exporter
for node in "$CC_NODE1_HOST" "$CC_NODE2_HOST"; do  ssh "$node" "sudo apt-get install -y opennebula-prometheus-kvm && sudo systemctl enable --now opennebula-node-exporter opennebula-libvirt-exporter"done
sleep 5for target in "$CC_FE_IP:9925" "$CC_FE_IP:9100" "$CC_NODE1_IP:9100" "$CC_NODE1_IP:9926" "$CC_NODE2_IP:9100" "$CC_NODE2_IP:9926"; do if curl -fs -o /dev/null "http://$target/metrics"; then echo "ok $target"; else echo "!! $target"; fidone~/cc/platform/observability/install-exporters.shIn the lab all six targets reported ok. The OpenNebula exporter knew the hosts a few seconds to half a minute after starting. Prometheus reaches the exporters through three ScrapeConfigs with the addresses of your parameters. Prometheus only picks up new ScrapeConfigs and ServiceMonitors once the config reloader sees the changed configuration. In the lab the jobs of the targets outside the cluster appeared two to five minutes after the push, and the job webshop after almost four minutes.
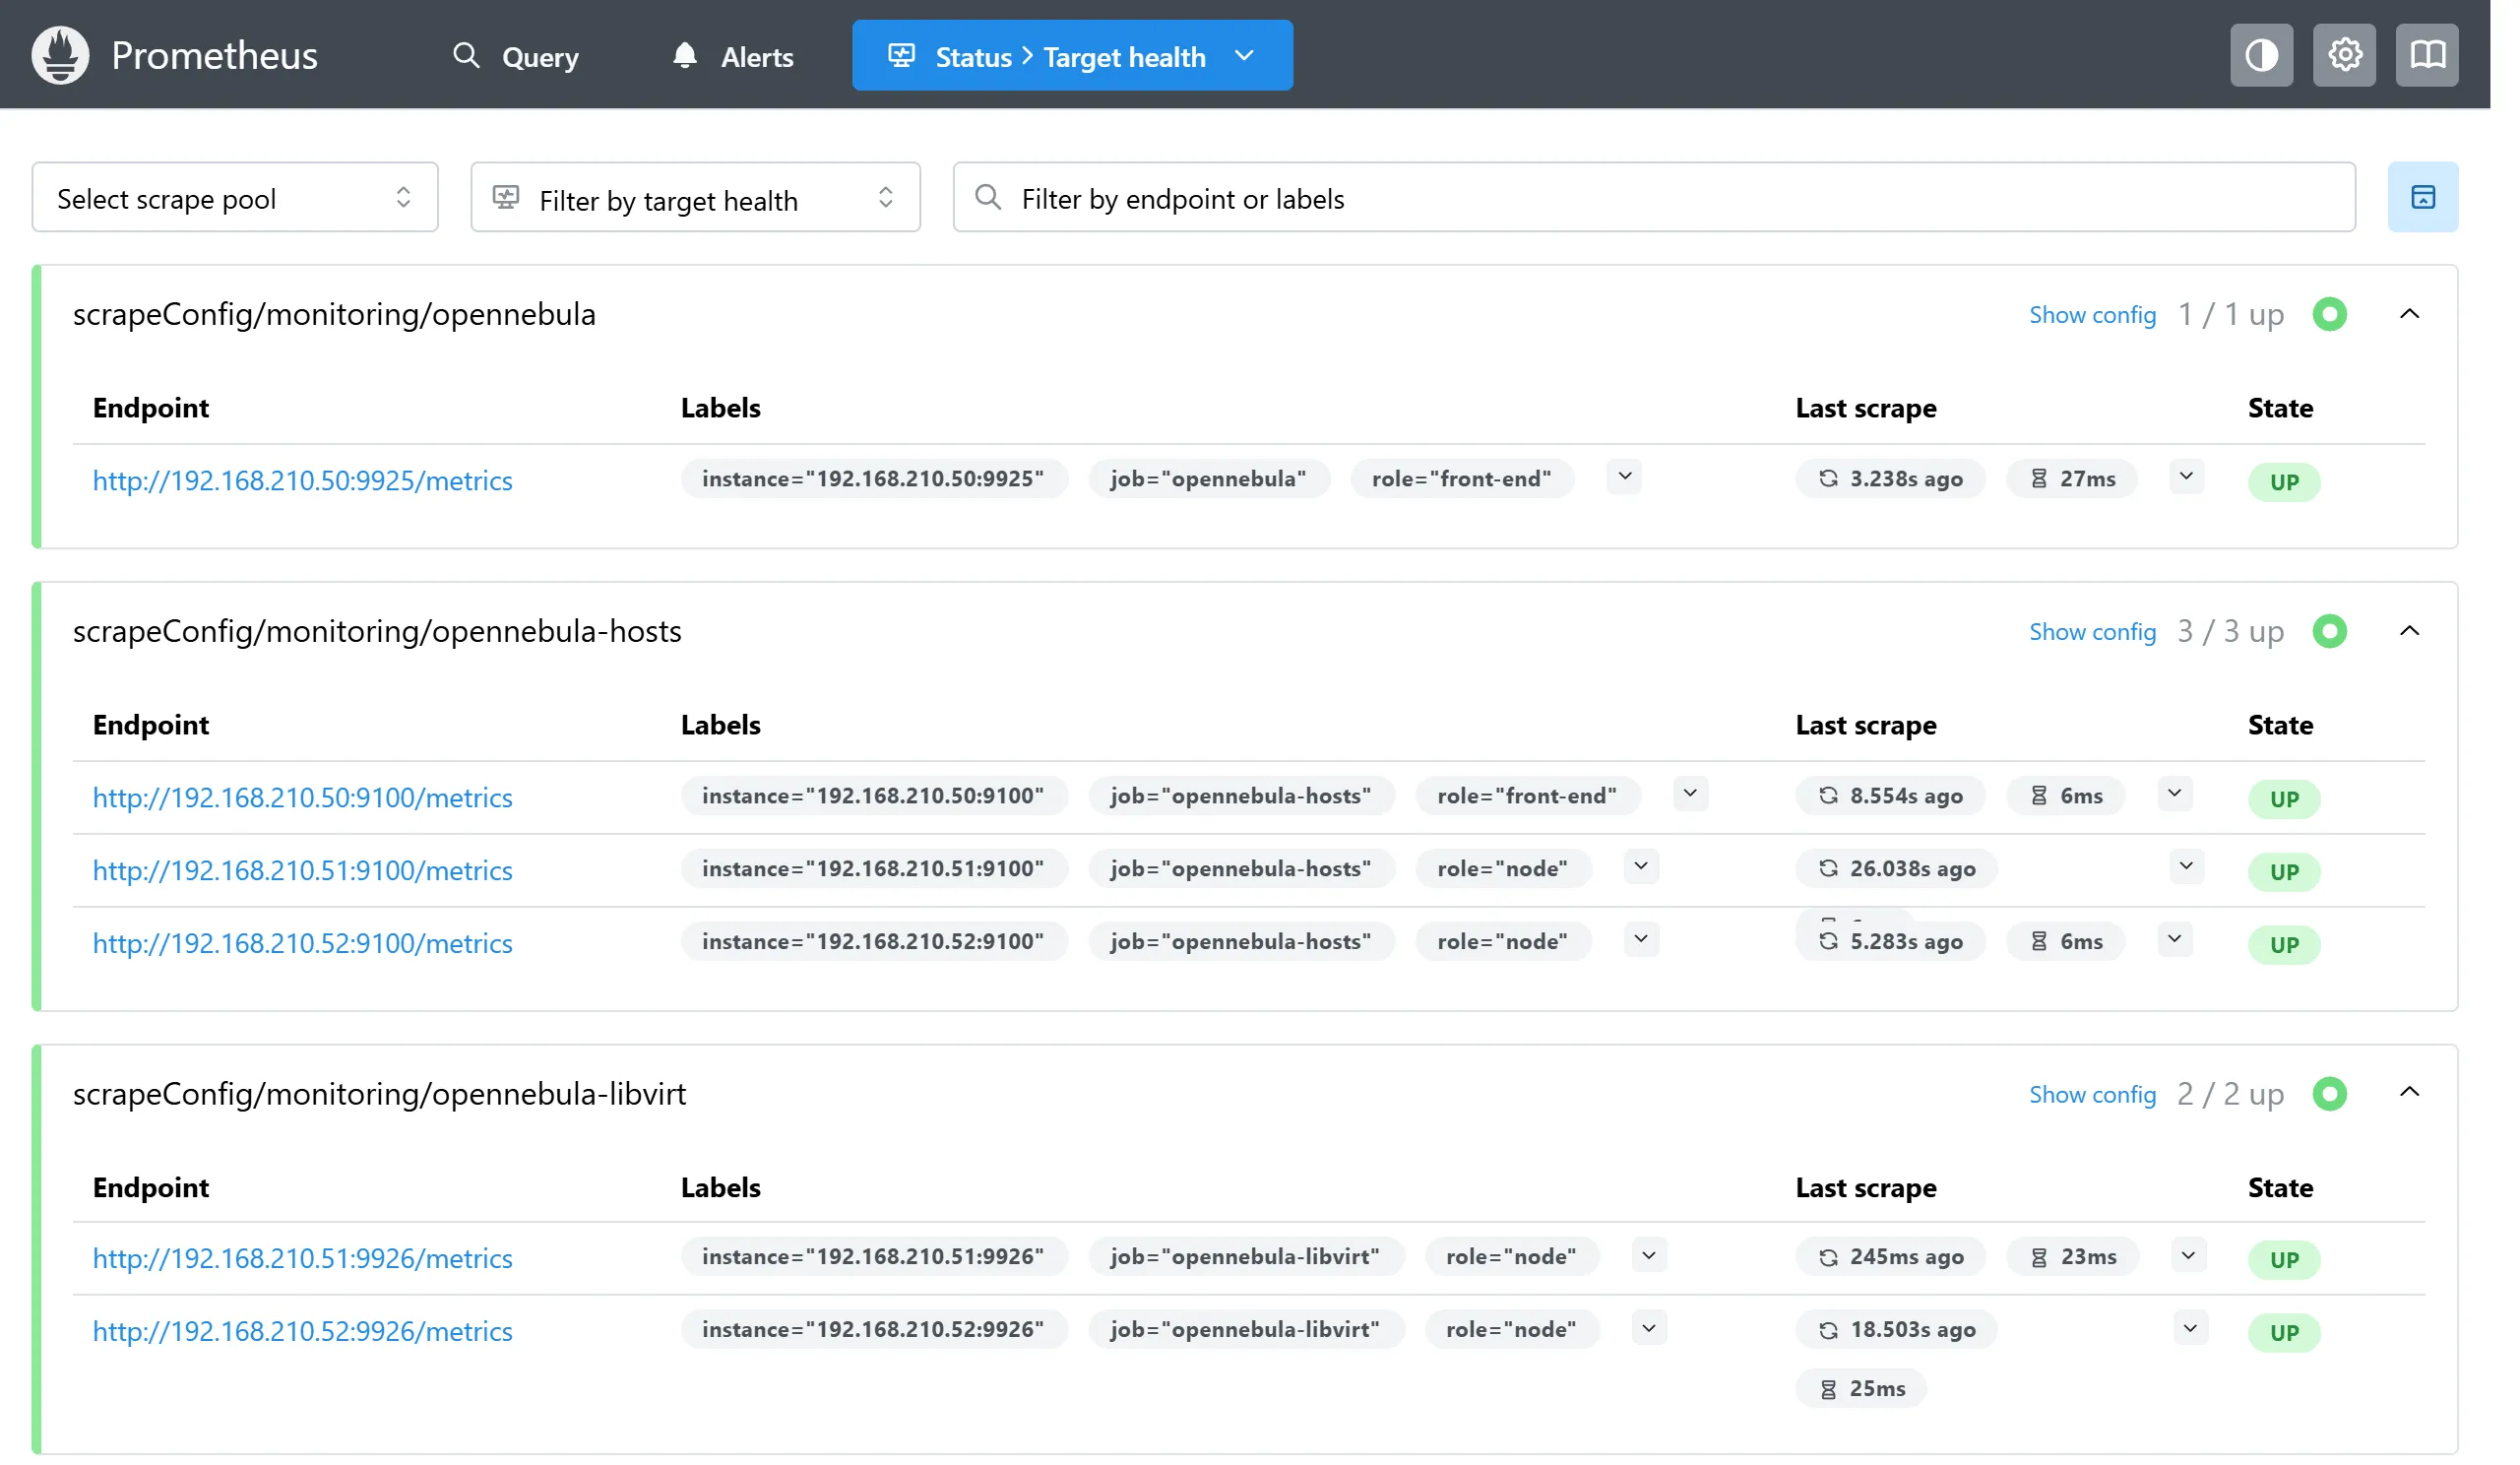
In Prometheus, "Status › Target health" shows every target with its state.
# The exporters of OpenNebula outside the cluster, the addresses come from the personal parametersapiVersion: monitoring.coreos.com/v1alpha1kind: ScrapeConfigmetadata: name: opennebulaspec: jobName: opennebula staticConfigs: - labels: role: front-end targets: - FRONTEND_IP:9925---apiVersion: monitoring.coreos.com/v1alpha1kind: ScrapeConfigmetadata: name: opennebula-hostsspec: jobName: opennebula-hosts staticConfigs: - labels: role: front-end targets: - FRONTEND_IP:9100 - labels: role: node targets: - NODE1_IP:9100 - NODE2_IP:9100---apiVersion: monitoring.coreos.com/v1alpha1kind: ScrapeConfigmetadata: name: opennebula-libvirtspec: jobName: opennebula-libvirt staticConfigs: - labels: role: node targets: - NODE1_IP:9926 - NODE2_IP:9926The web shop as a target
Section titled “The web shop as a target”For the web shop, a ServiceMonitor next to its deployment is enough. Prometheus then scrapes every pod behind the service webshop.
# Prometheus reads /metrics of every web shop pod every 15 secondsapiVersion: monitoring.coreos.com/v1kind: ServiceMonitormetadata: name: webshopspec: selector: matchLabels: app: webshop endpoints: - port: http path: /metrics interval: 15sSo far, the member NetworkPolicy of chapter 4.5 only admitted traffic from the member's own namespace and kube-system. Without a change, Prometheus would not reach /metrics. The new version of the template also admits the namespace monitoring.
# Pods of a member accept traffic only from their own namespace, from the ingress of k3s in kube-system# and from Prometheus in monitoringapiVersion: networking.k8s.io/v1kind: NetworkPolicymetadata: name: memberspec: podSelector: {} policyTypes: - Ingress ingress: - from: - podSelector: {} - namespaceSelector: matchLabels: kubernetes.io/metadata.name: kube-system - namespaceSelector: matchLabels: kubernetes.io/metadata.name: monitoringOnce you have pushed everything, Argo CD rolls out the stack. In the lab it was synced and healthy 140 to 160 seconds after the push.
git add .git commit -m "Monitoring with Prometheus, Grafana and the OpenNebula exporters"git pushkubectl -n monitoring get podsPromQL
Section titled “PromQL”Like Argo CD, you reach Prometheus and Grafana through a tunnel, Prometheus on port 30090 and Grafana on port 30300 of the server. You open the tunnel from the client, which is the Kali VM on smartlearn and your PC with an own hypervisor.
ssh -L 9090:<server-address>:30090 -L 3000:<server-address>:30300 mmuster-feIn the browser of the client, http://localhost:9090/targets lists every target with its state. All of them were up in the lab, including the OpenNebula jobs opennebula, opennebula-hosts and opennebula-libvirt and the job webshop. Under "Query" you try out queries.
| Query | Result |
|---|---|
up | 1 for every reachable target, 0 otherwise |
opennebula_host_mem_usage_bytes / opennebula_host_mem_total_bytes | share of each node's memory taken by VMs |
rate(webshop_requests_total[5m]) | requests per second, averaged over five minutes |
sum by (code) (rate(webshop_requests_total[5m])) | the same, added up by status code |
histogram_quantile(0.95, sum by (le) (rate(webshop_request_duration_seconds_bucket[5m]))) | time within which 95% of the requests are answered |
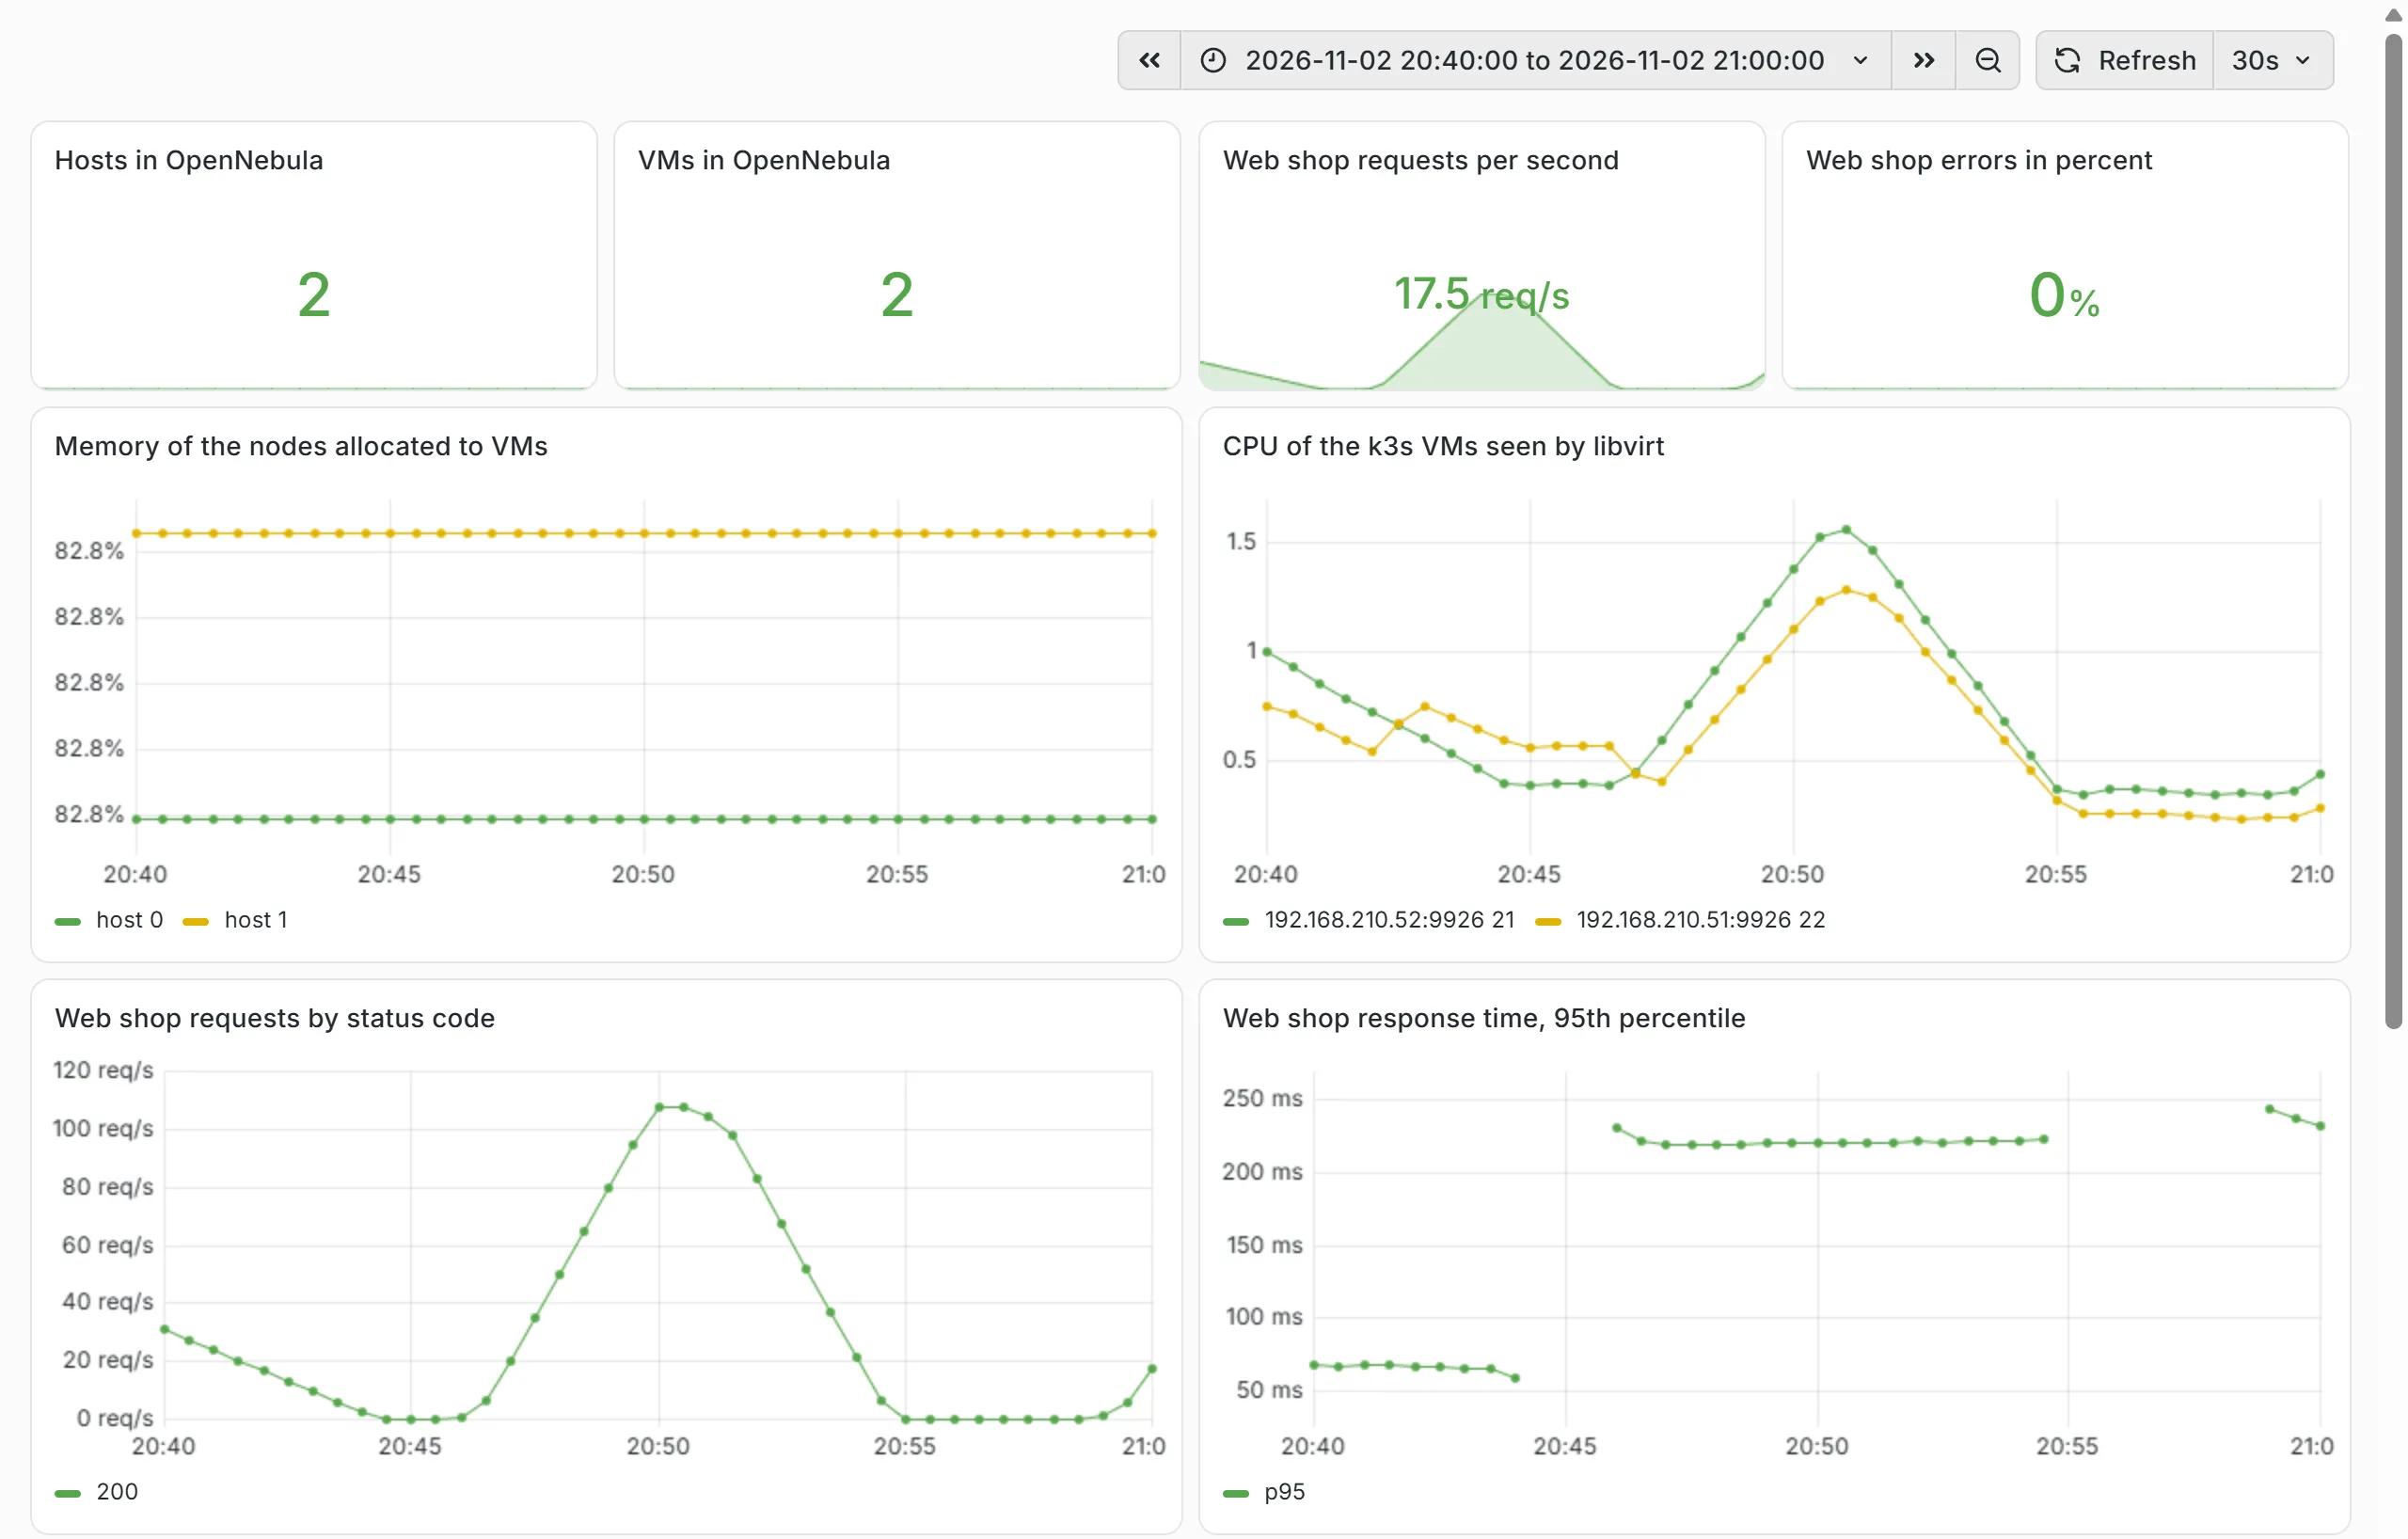
A counter on its own says little, because it only rises from the moment the pod starts. rate() turns it into a change per second and also copes with restarts, when the counter drops to zero. sum by combines time series and keeps only the labels you name. According to the second query, the k3s VMs took 83% of the memory OpenNebula can hand out on each node in the lab.
Grafana
Section titled “Grafana”Grafana shows queries as dashboards. In the browser of the client, you sign in at http://localhost:3000/ as admin, with the password from ~/cc-lab/grafana.pass on the front-end. The chart brings dashboards for Kubernetes, such as "Kubernetes / Compute Resources / Namespace (Pods)". The platform team adds a dashboard of its own from Git, monitoring/config/dashboard-wolkenwerk.yaml. It shows OpenNebula hosts and VMs, traffic, errors and response time of the web shop, CPU per namespace and the members' memory against their quota. Grafana loads every ConfigMap with the label grafana_dashboard by itself.
For a panel of your own, copy an existing panel in monitoring/config/dashboard-wolkenwerk.yaml and give it your own title, your query in expr and a free place in gridPos, for example below the existing panels with "y": 28. The panels in the file have no id, and yours needs none either. Then push the change. For a panel you designed in Grafana, the panel menu shows its JSON under "Inspect" and "Panel JSON". The JSON model of Grafana 13.3 describes the fields of a dashboard and its panels.
Exercise Lab
Roll out the stack, install the exporters and show in Prometheus that all targets are up. Open the dashboard "Wolkenwerk platform" and create traffic on the web shop with curl.
Solution
kubectl -n argocd get applications shows monitoring and monitoring-config as Synced and Healthy. Under Targets you find the job opennebula with one target, opennebula-hosts with three, opennebula-libvirt with two and webshop with one target per pod. After a few curl http://<server-address>/, the dashboard shows requests with code 200.
Exercise A query of your own
Gemeinde Hinterbüel wants to know how many VMs are running in OpenNebula right now and how much CPU they claim in total. Write the queries.
Solution
count(opennebula_vm_state == 3) counts the VMs in the active state. The help text of the metric says which number stands for which state. sum(opennebula_host_cpu_usage_ratio) adds up the CPU OpenNebula has allocated to VMs on all nodes. For the real load instead of the allocation, use sum(rate(opennebula_libvirt_cpu_seconds_total[5m])) from the nodes.
Exercise Saturation
Which query would have shown you in chapter 4.2 that the cluster had no room next to the VMs of parts 2 and 3?
Solution
opennebula_host_mem_total_bytes - opennebula_host_mem_usage_bytes shows, per node, the memory OpenNebula can still hand out. With the web servers, the practice's VMs and the fiduciary office's service, it was below the 6 GB a cluster VM needs.
Text and figures are licensed under CC BY-SA 4.0 and the code under the MIT License. The sources are on GitHub.